Finnish taxation is lower than in most comparable countries
Imagine the scene: a politician steps up to the podium and declares that “Finland has one of the highest tax burdens in the world.” The audience nods anxiously. The claim feels credible because it is repeated in the media and on discussion forums. But when you look more closely at the statistics, the claim turns out to be an illusion—a statistical artifact that arises when different countries’ tax figures are compared as if they were directly comparable.
In reality, Finland’s total tax rate is not exceptionally high internationally when the comparison is done correctly. The crucial difference lies in occupational pensions. In Finland, statutory earnings-related pension contributions are included in the total tax rate. In many other countries—for example, Sweden, Denmark, and the Netherlands—a significant part of pension contributions is recorded differently in the statistics and is not counted in the same tax-rate figure. When these differences are corrected and pension contributions for all countries are added to their tax rates, the picture changes dramatically.
The trap of the bad comparison
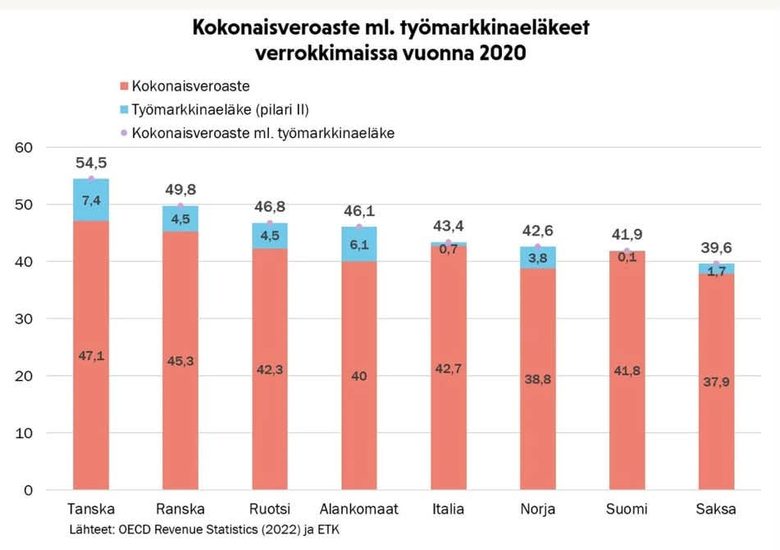
A typical misleading comparison arises when a researcher or politician picks up a raw tax-rate figure from the OECD or another statistical source without adjustment. Using 2020 figures, for instance, Finland would appear to be close to Sweden: Finland’s tax rate was 41.8 per cent and Sweden’s 42.3 per cent. The difference seems negligible. But when Sweden’s occupational pensions (4.5 percentage points) are added to its figure, Sweden’s adjusted tax rate rises to 46.8 percent—more than four percentage points higher than Finland’s. Similarly, the gap between Denmark’s raw figure (47.1%) and Finland’s (41.8%) widens after adjustment to more than 12 percentage points (54.5% vs. 41.9%).
An even more blatant example is the populistic claim that Finland’s tax rate is “the second highest in the world after North Korea”—a claim that was later shown to be false, since North Korea’s tax rate is minimal. Such assertions do not withstand statistical scrutiny, yet they persist in public debate.
Why are inaccurate comparisons used?
Inaccurate comparisons are rarely accidental. They are often driven by political interests and economic-policy beliefs. When the goal is to justify tax cuts, cuts in public spending, or a scaling back of the welfare state, it is useful to create an impression that Finnish taxation is exceptionally heavy. Presenting a raw tax-rate figure without the pension adjustment then serves a clear agenda: it provides a semblance of statistical support for austerity measures.
Behind this often lies a broader economic-policy mindset that can be described as neoliberal. Within this framework, a “high tax rate” functions as an argument to legitimize a reduction of the public sector. It is important to note, however, that not all inaccurate comparisons are conscious manipulation: some stem from genuine methodological ignorance or from the complexity of statistics, which makes adjustments difficult to perform. The media, for its part, readily reproduces simple numbers without deeper analysis.
The corrected picture: Finland is not at the top of the tax league.
When the comparison is done correctly—by adding occupational pensions to all countries’ tax rates—Finland’s position looks very different. The table shows that in 2020 Finland’s adjusted total tax rate was 41.9 percent, while Denmark (54.5%), France (49.8%), Sweden (46.8%), the Netherlands (46.1%), Italy (43.4%), and Norway (42.6%) were all higher. Only Germany (39.6%) was below Finland.
| Country | Total tax rate (base, OECD/ETK) | Impact of occupational pensions (pp) | Total tax rate incl. occupational pensions, 2020 |
|---|---|---|---|
| Denmark | 47.1% | +7.4 | 54.5% |
| France | 45.3% | +4.5 | 49.8% |
| Sweden | 42.3% | +4.5 | 46.8% |
| Netherlands | 40.0% | +6.1 | 46.1% |
| Italy | 42.7% | +0.7 | 43.4% |
| Norway | 38.8% | +3.8 | 42.6% |
| Finland | 41.8% | +0.1 | 41.9% |
| Germany | 37.9% | +1.7 | 39.6% |
Source: OECD and the Finnish Centre for Pensions (ETK).
Finland is therefore not at the top of the tax league but rather in the middle—and at a lower level than most of its peer countries. This does not mean that tax policy debates are unimportant. It simply means that the debate should be based on correctly made comparisons, not on statistical illusions.
1.11.2026 Pentti Rautio
Additional material for reading (in Finnish):
Lainà, P. (2026). Hyvinvointiyhteiskunnan sopimusperustainen rahoitussuunnitelma. Teoksessa A. Helo (toim.), Liberaalina Suomessa: Esseitä hyvinvointiyhteiskunnan eurooppalaisesta arvopohjasta. Atrain & Nord.
#MythOfHighTaxes #Taxation #TotalTaxRate #OccupationalPensions #PensionContributions #OECD #ETK #Statistics #Comparison #EconomicPolicy #TaxPolicy #WelfareState #StatisticalIllusion #Nordics #Finland